The Realized Value of Unpaid Time

Time matters for each of us whether unpaid or not. Reducing our individual time on the planet to a binary expression between paid and unpaid shortchanges the value we bring to our common humanity during our lifetimes. This raises a couple of questions for consideration in this post:

  1. How to measure the value of unpaid time?
  2. How to pay the provider for this value rendered?

In my previous post, Unpaid Time Distribution, I noted that unpaid time can be voluntary or involuntary. Examples of the former include a leave of absence from paid work, participation as a volunteer or intern within the public or private sector, or a lifestyle decision to live “off the grid.” As the wording suggests, involuntary unpaid time is not necessarily an outcome of choice, but the result of unemployment and unavailability of paid time due to termination, reduction in force, early retirement, sour reputation, etc.

Regardless of being voluntary or involuntary, unpaid time remains unaccounted for in contrast to paid time where value can be measured by productivity and profit. If unpaid time has value how does one generate and measure it? The diagram below, “Value of Unpaid Time,” gives us a way to look at it:

The left side of the diagram below lists items we use to spend our unpaid time: cell phones, computers, devices (includes Internet of Things), games, apps, and GPS to name the more obvious ones. The right side lists the data we generate by using the aforementioned items: identity, location, behaviors, connections, content, and access and myriad variations on each. Organizations in the public and private sectors use these streams of data to increase profits, pacify populations, and concentrate wealth. In other words, they capture, measure, and realize the value generated by us during our unpaid time activities.

So important is the data we generate that organizations in both the public and private sectors vie tirelessly for our attention.  The diagram below, “Public and Private Sectors,” illustrates some of the resulting dynamics:

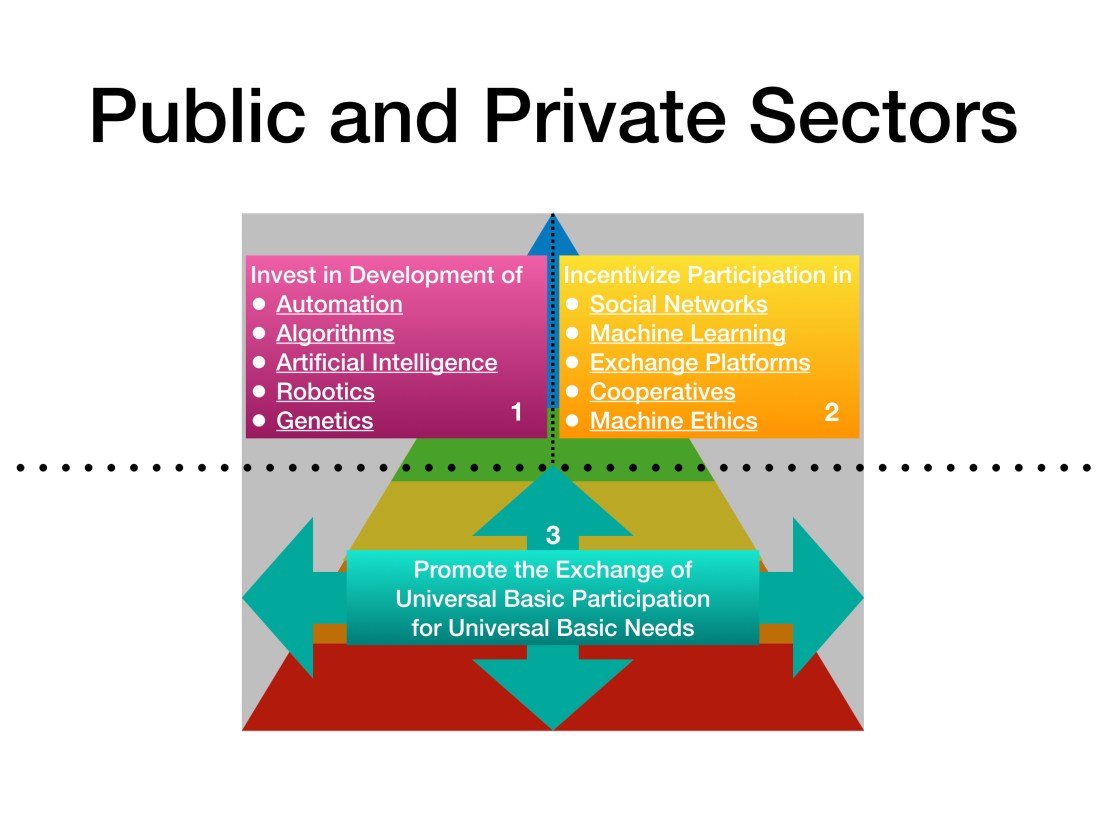
These entities combine investment in the development of information and knowledge technologies (section 1) with sophisticated interface designs and structures to incentivize our participation (section 2) so that the resulting data streams are plentiful, wide and deep. In effect, we humans become living sensors who generate data through social networks, machine learning, exchange platforms, cooperatives, and machine ethics that can be put to use by automation, algorithms, artificial intelligence, robotics, and genetics.

Ideally, all of us would be plugged in 24/7 – a kind of universal basic participation that generates a lifelong stream of data about us and for us. The incentives would go beyond gamification and dopamine rushes to payment in the currency of basic needs. In other words, we would allow data about us to be captured by the machine on a continuous basis in exchange for our universal basic needs of food, water, clothing, housing, energy, safety, security, healthcare, education, socialization, etc. (section 3).

The issue isn’t that the value of unpaid time can’t be measured, it’s that it’s not paid.

And if it is paid?

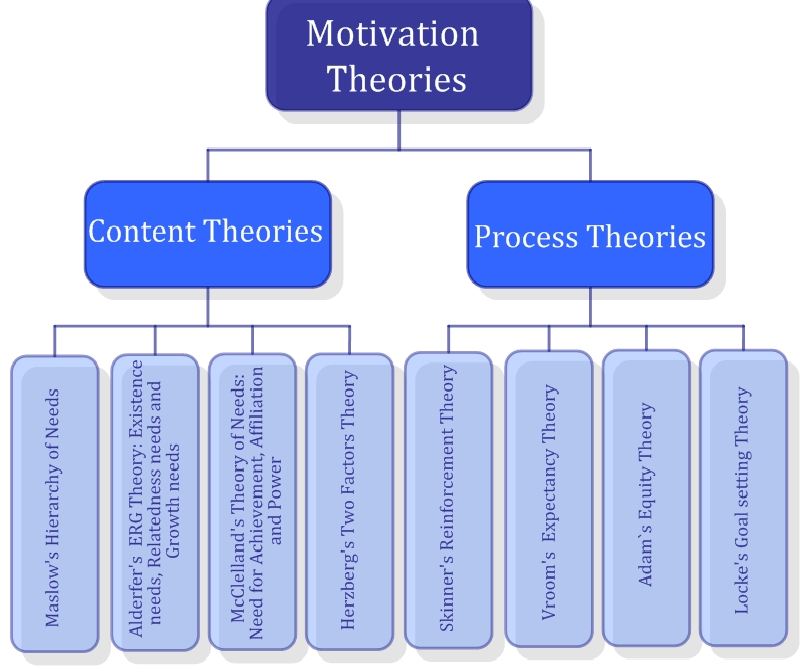
The diagram above summarizes what “everyone wins” could mean:

  • Organizations win because costs are reduced (Maslow’s Hierarchy upright)
  • Individuals win because each can be creative within the boundaries imposed by nature, not man / machine (Maslow’s Hierarchy upside down)
  • Humanity and the machine both win because they learn from one another, adapt to each other and the world that encompasses them both (Maslow’s Hierarchies – upright and upside down)

No doubt these are topics for many future posts…

Paid Time Distribution

The principle way we earn money is by being paid for our time fulfilling the contracted terms of a job description or statement of work.

This paid work, called “jobs” for the sake this post, can be offered by employers or contractors in the public sector or the private sector, which covers non-governmental organizations (NGO) and cooperatives among others.

Not all jobs are created equal in terms of paid time distribution. Some pay more than others for the same block of time. As a rule, jobs that pay more are harder to find and the requirements to get them are more stringent.  Conversely, lower paid jobs may be more plentiful and easier to get, but a person must work multiple jobs to earn the equivalent of a higher paying one. As a result, pay scale determines the time a person spends in paid work and the range of choices a person has to participate in quality of life activities outside of paid work.

The diagram below applies these characteristics of jobs and pay to Maslow’s Hierarchy.

Doing so shows how the distribution of paid time relates to meeting basic needs and enjoying a reasonable quality of life. The demarcation between these two can be represented as a poverty line. In this case, the poverty line represents the amount of income from paid time from employment, public services, and volunteer services sufficient to meet one’s basic needs.

At a minimum, a fully functional society assures each member receives daily basic needs in exchange for 24-hours of life in that society. Ideally, society provides opportunities for each member to meet daily basic needs through no more than 8 hours of paid time, leaving 16 hours of unpaid time available for sleep and quality of life endeavors as described in the previous post, Lifetime Hours Revisited.

Oftentimes, societies fall short of the ideal and, in more difficult situations, fail to be fully functional. The consequences are borne by families that must put more time into paid work or supplement it with income from public services and volunteer services in order to meet their basic needs. The diagram below illustrates this dynamic in the form of a question:

Of course, at the heart of this question is an even more fundamental one which asks what does the future hold for a family that cannot spend the time and generate enough income from all sources to procure basic needs? And what does that say about the condition of the society to which those families belong?

Questions for consideration in subsequent posts…

Motivation to Allocate Your 700,000 Hours

The mere fact that we live means that we allocate our allotted time on the planet to various activities. Even though we may have myriad alternatives as to what we could do with our time at any given moment, most are mutually exclusive. For instance, as I’m writing this, I’m not able to do anything else at the same time. In other words, I must choose this activity and let others go by. This internal zero-sum game we’re forced to play makes time our scarcest resource.

As distasteful as playing the game may seem, we do have to take responsibility for our decisions about how we use our time or the resource slips away and we risk regret over lost opportunities or, worse yet, we find our lives imperiled. Such responsibility taking is at the heart of why we do what we do when we do it. Human motivation is the longstanding subject of ongoing research, study and analysis resulting in a number of theories to explain it. The following diagram from Psychology by Juliánna Katalin Soós and Ildikó Takács (2013), identifies several of the more prominent ones.

MotivationTheoriesDiagram.png

For the purpose of this post, Abraham Maslow’s Hierarchy of Needs is the theory of choice because is well-known, easy to understand, and widely accepted as a framework for examining human motivation (see diagram below).  It can become the basis for each of us to consider in how we spend our 700,000 hours.

Maslow’s theory suggests that under natural circumstances we would divide a 24-hour period into thirds with one-third dedicated to sleep – an essential physiological need about which we are only now beginning to understand the degree of importance it holds, (see Why Sleep Is Important), another third to the remaining basic needs we all have, and the final third to achieving an improved quality of life the characteristics of which are unique to each of us.

The diagram below positions Maslow’s Hierarchy of Needs in between a couple of ways to carve-up a 24-hour period in relation to it:

The left-hand time stack, entitled Work-Life Balance, shows three equal 8-hour segments in keeping with the “natural” division of a given 24-hour period described above. While an even split may seem idealized, the intent is to emphasize the importance of a balanced allocation of one’s time as the foundation for a healthy and satisfying life. Just as successful personal finance strategies emphasize the importance of investing in a diverse portfolio for better long-term results, balancing one’s daily life offers the best return on investment for one’s 700,000 hours.

The right-hand stack, entitled Koyaanisqatsi – the Hopi word for “unbalanced life” – illustrates a disproportionate allocation of time in a day to meeting basic needs. The result is that one must make trade-offs between sleeping less in order to have some modicum of quality of life or sacrificing higher aspirations altogether in exchange for longer sleep. Regardless, an unbalanced life inexorably becomes one that is unhealthy either physically or psychologically or both. And this condition is frequently a point of discussion and debate among those who study it, suffer because of it, offer relief from it, and even contribute to it as mentioned in these articles: Is the Stuff You Buy Over 20 Years Worth 40,000 Hours of Time? – The New York Times and Buying Time, Not Stuff, Might Make You Happier : Shots – Health News : NPR.

So, how does your life stack up?  Does it matter in how you make your decisions about how to spend your time from one day to the next? If it does matter and you want to change it, how will you go about doing so?